
✤ Setup Conditions:
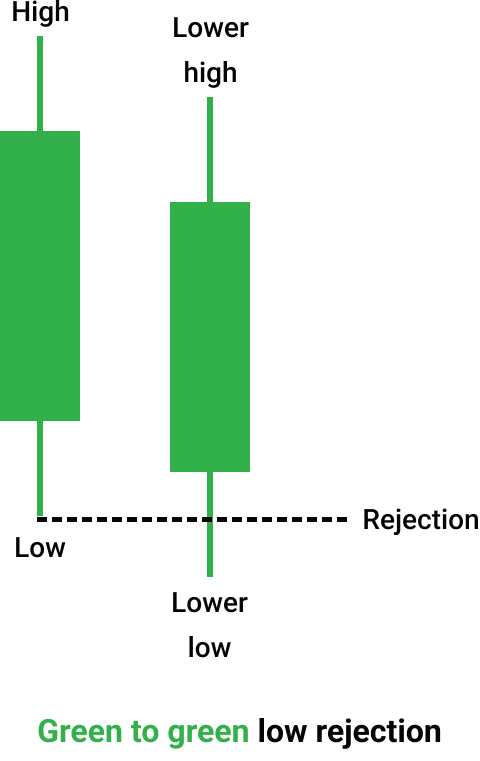
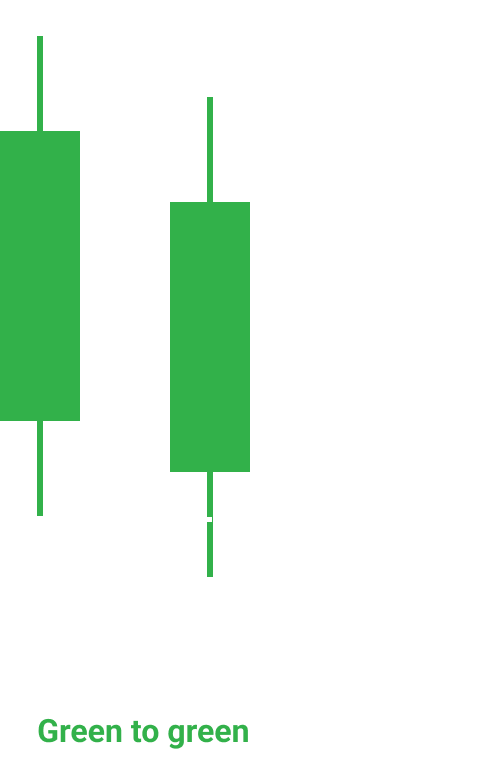
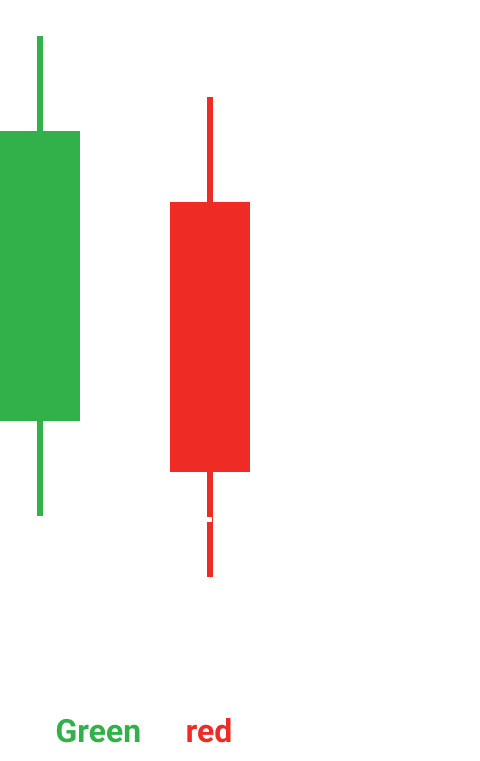
✤ Green to green rejection
1. 1st candle’s close must be greater than 1st candle’s open, it means 1st candle is a bullish candle.
2. 2nd candle’s close must be greater than 2nd candle’s open, it means 2nd candle is a bullish candle.
3. 2nd candle’s high must be less than 1st candle’s high, it means 2nd candle has a lower low.
4. 2nd candle’s low must be less than 1st candle’s low, it means 2nd candle is a lower high.
5. 2nd candle’s close must be greater than 1st candle’s high, it means 2nd candle is a rejection candle.
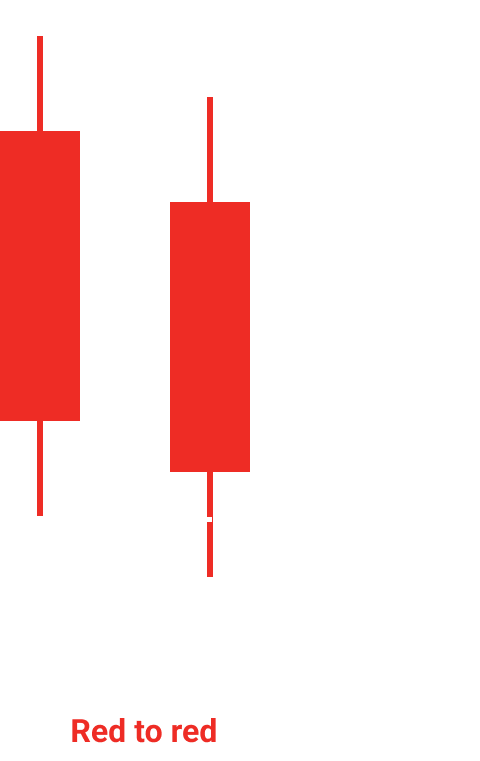
✤ Red to red rejection
1. 1st candle’s close must be less than 1st candle’s open, it means 1st candle is a bearish candle.
2. 2nd candle’s close must be less than 2nd candle’s open, it means 2nd candle is a bearish candle.
3. 2nd candle’s high must be less than 1st candle’s high, it means 2nd candle has a lower high.
4. 2nd candle’s low must be less than 1st candle’s low, it means 2nd candle is a lower low.
5. 2nd candle’s close must be greater than 1st candle’s high, it means 2nd candle is a rejection candle.
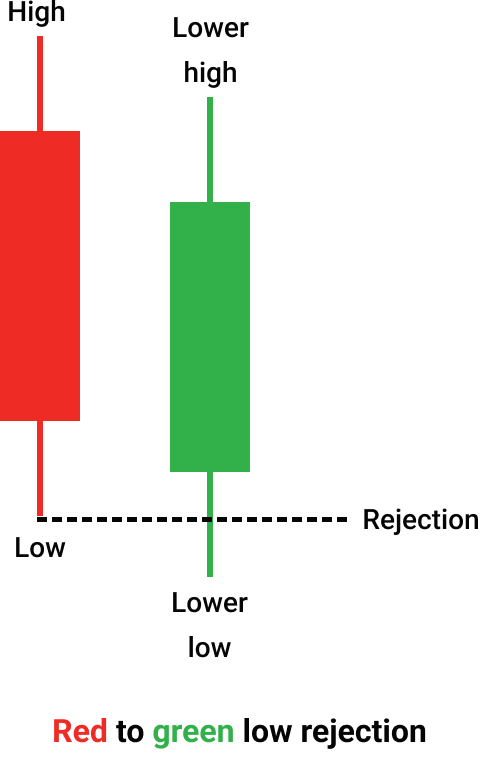
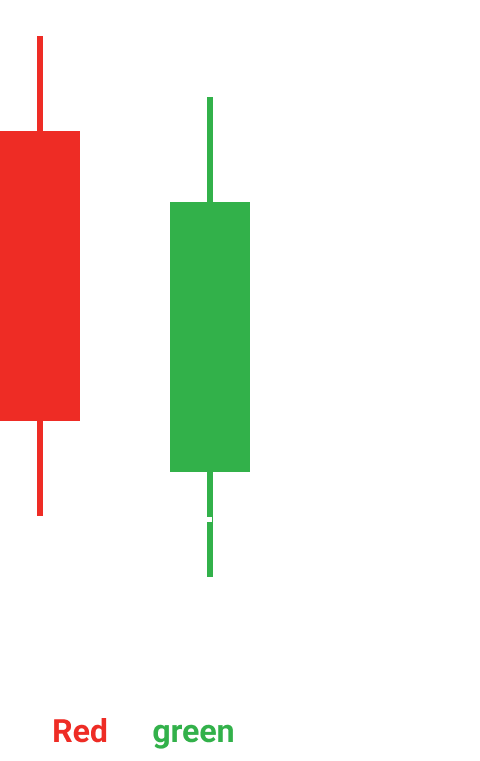
✤ Red to green rejection
1. 1st candle’s close must be less than 1st candle’s open, it means 1st candle is a bearish candle.
2. 2nd candle’s close must be greater than 2nd candle’s open, it means 2nd candle is a bullish candle.
3. 2nd candle’s high must be less than 1st candle’s high, it means 2nd candle has a lower high.
4. 2nd candle’s low must be less than 1st candle’s low, it means 2nd candle is a lower low.
5. 2nd candle’s close must be greater than 1st candle’s high, it means 2nd candle is a rejection candle.
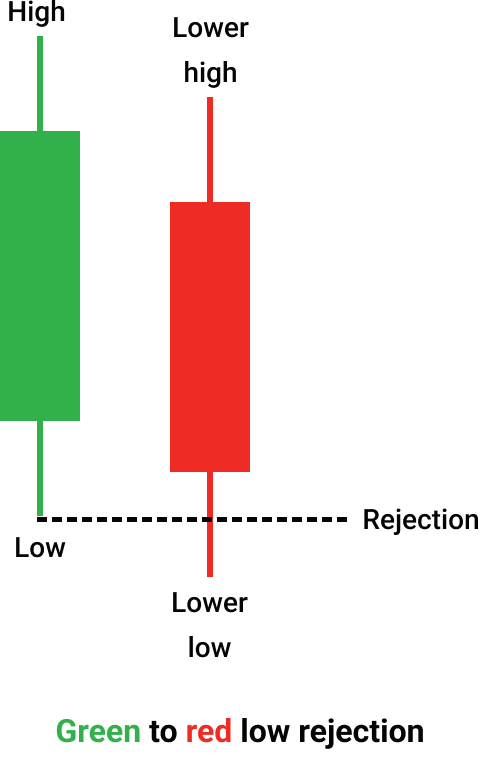
✤ Green to red rejection
1. 1st candle’s close must be greater than 1st candle’s open, it means 1st candle is a bullish candle.
2. 2nd candle’s close must be less than 2nd candle’s open, it means 2nd candle is a bearish candle.
3. 2nd candle’s low must be less than 1st candle’s low, it means 2nd candle is a lower low.
4. 2nd candle’s close must be greater than 1st candle’s high, it means 2nd candle is a rejection candle.
5. Rejection:
✤ In financial markets, rejection refers to a situation where the price attempts to move beyond a certain level—such as a support, resistance, or key psychological level—but fails to sustain the move, signaling a lack of momentum in that direction. This often leaves behind visual cues on a candlestick chart, such as long wicks or shadows, indicating market hesitation or reversal.
☛ Key Features of Rejection:
✤ Long Wick or Shadow
✤ The wick represents the area where price attempted to go but was "rejected."
☛ Upper Wick: Indicates rejection of higher prices, often signaling bearish sentiment.
☛ Upper Wick: Indicates rejection of higher prices, often signaling bearish sentiment.
☛ Occurs Near Key Levels:
✤ Resistance Rejection: When price tests a resistance level but cannot break above it.
☛ Support Rejection: When price tests a support level but does not break below it.
☛ Market Sentiment Shift:
✤ Shows that buyers or sellers are stepping in to defend a certain price level, potentially leading to a reversal or consolidation
☛ Examples of Rejection in Candlestick Patterns:
✤ Examples of Rejection in Candlestick Patterns:
☛ Hammer Candle (Bullish Rejection): Long lower wick, small body; often signals reversal from downtrend.
☛ Shooting Star (Bearish Rejection): Long upper wick, small body; often signals reversal from uptrend.
☛